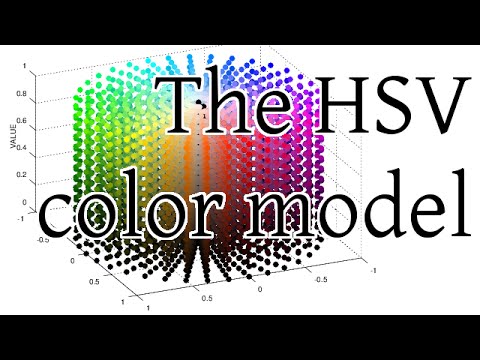
In this video we explain the HSV color model and provide an animation on how to create the HSV color cylinder.
The main animation starts at 1:19
As follows, the source code (in octave) to create the steps for the animation:
please replace the some markers by the corresponding symbol (youtube does not allow), such as |open_brackets|, or |close_braces|, etc
clear all;
figure(1);
clear plot;
clf;
MIN_I = 0;
STEP_I = 0.075;
MAX_I = 1;
MIN_S = 0;
STEP_S = 0.1;
MAX_S = 1;
MIN_H = 0;
STEP_H = 10;
MAX_H = 360;
vector_i = |open_brackets||close_brackets|;
vector_h = |open_brackets||close_brackets|;
vector_s = |open_brackets||close_brackets|;
my_struct = struct();
position_size = 0;
for i = MIN_I:STEP_I:MAX_I
for s = MIN_S:STEP_S:MAX_S
for h = MIN_H:STEP_H:MAX_H
if (s |less_than| 0.2)
h += STEP_H;
endif;
position_i = i;
position_h = s * sin(h * pi / 180);
position_s = s * cos(h * pi / 180);
int_i = position_i * 100;
int_h = position_h * 100;
int_s = position_s * 100;
|open_brackets|r, g, b|close_brackets| = ihs_to_rgb(i, h, s);
ihs_distance = sqrt(int_i^2 + int_h^2 + int_s^2);
ihs_name = sprintf('%09d - %09d - %f %f %f', int_i, ihs_distance, int_i, int_h, int_s);
my_struct = setfield(my_struct, |open_braces|1|close_braces|, ihs_name, |open_braces|position_i position_h position_s r g b i h s|close_braces|);
position_size++;
endfor
endfor
endfor
ordered_struct = orderfields(my_struct);
animation_step = 0;
degree = 110;
degree_final = 160;
degree_step = (degree_final - degree) / position_size;
for |open_brackets|val, key|close_brackets| = ordered_struct
i = val|open_braces|1|close_braces|;
h = val|open_braces|2|close_braces|;
s = val|open_braces|3|close_braces|;
r = val|open_braces|4|close_braces|;
g = val|open_braces|5|close_braces|;
b = val|open_braces|6|close_braces|;
value_i = val|open_braces|7|close_braces|;
value_h = val|open_braces|8|close_braces|;
value_s = val|open_braces|9|close_braces|;
# plot data
plot3(h, s, i, '*', 'color', |open_brackets|r g b|close_brackets|, 'linewidth', 5);
# configure plot
zlabel('VALUE');
axis(|open_brackets|-1 1 -1 1 0 1|close_brackets|);
title_str = sprintf('H = %d\nS = %0.2f\nV = %0.2f', value_h, value_s, value_i);
#title(title_str, 'horizontalAlignment', 'left');
grid on;
box off;
# rotate the graph according to current degree
view(degree, 30 + 7.5 * sin(degree/60));
degree = degree + degree_step;
hold on;
output_filename = sprintf('ihs-steps/animation-%09d.png', animation_step);
print(output_filename, '-S560,420', '-dpng', '-color');
animation_step = animation_step + 1;
endfor
function |open_brackets|R, G, B|close_brackets| = ihs_to_rgb(i, h, s)
H = h / 360;
S = s;
V = i;
# based on transformation HSV to RGB
H = H * 6;
I = floor(H);
F = H - I;
M = V * (1 - S);
N = V * (1 - (S * F));
K = V * (1 - (S * (1 - F)));
R = 0;
G = 0;
B = 0;
if (I == 0)
R = V;
G = K;
B = M;
elseif (I == 1)
R = N;
G = V;
B = M;
elseif (I == 2)
R = M;
G = V;
B = K;
elseif (I == 3)
R = M;
G = N;
B = V;
elseif (I == 4)
R = K;
G = M;
B = V;
elseif (I == 5)
R = V;
G = M;
B = N;
endif
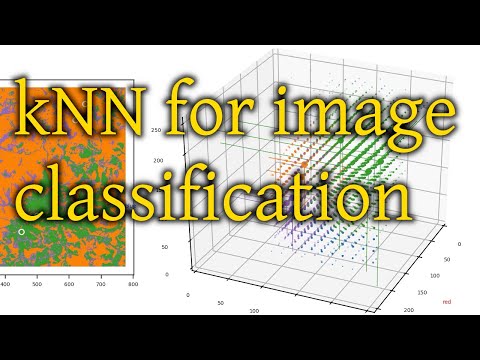
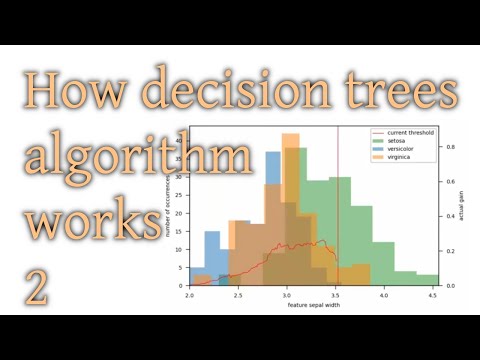 In this video I show the gain computation for all features and valid data intervals to create a decision tree. I used the Iris dataset, available at scikit-learn opendatasets module plus some data augmentation technique using basic random noise to create more samples.